

PingHoot Features / Monitoring History
Monitoring history
at your fingertips.
See every check, track incidents and understand how your websites have been performing over time. PingHoot keeps a detailed history so you can investigate issues and spot trends.
Start monitoring for free5 monitors freeNo credit cardSet up in seconds
Your sites
All systems operationalThe little coffee shop
https://coffee.example
Your next big idea
https://nextbigidea.example
The portfolio
https://portfolio.example
Owl good. All sites up.
All monitored websites are passing their checks.
What is monitoring history
Understand what happened, and when.
PingHoot keeps a detailed history of every check we perform on your websites, including the result, HTTP status code and response time.
This makes it easy to investigate issues, see how your website has been performing over time and identify any recurring problems.

Whether you're checking a recent downtime alert or just curious about your site's performance, your retained history is available in your dashboard.
View every check
and result.
See when incidents
occurred.
Track response times
over time.
Filter and find the
information you need.
Check history
Detailed information
for every check.
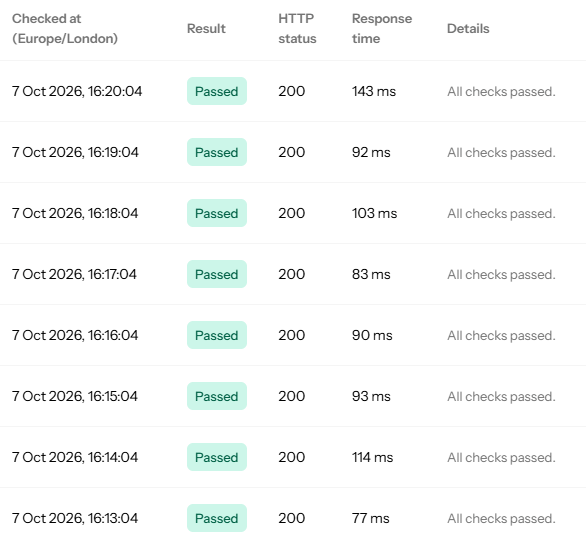
Within each website monitor you can see a complete history of all checks (within your plan's data retention limits), including the date and time, whether the check passed or failed, the HTTP status code, and the response time.
Pass or fail result
See if each check was successful or failed.
HTTP status code
View the exact status code returned.
Response time
See how long each request took, plus average, quickest and slowest successful response times for your selected period.
Filter by date and time
Choose the time period you want to view.
Downtime only view
Quickly filter to show just the failed checks.
Incident history
A complete record
of incidents.
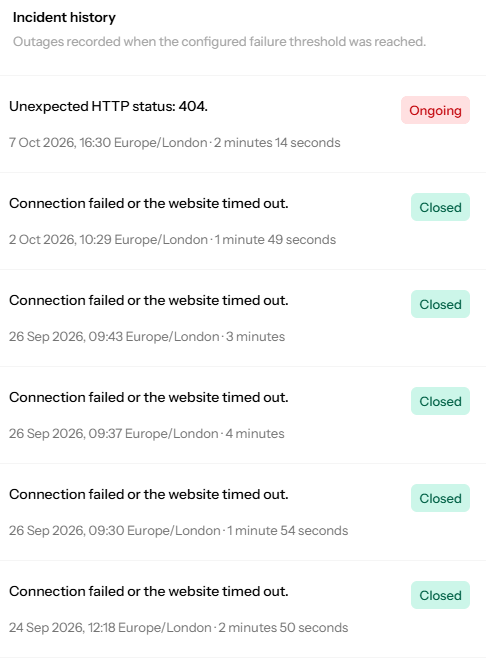
Each monitor also shows a list of incidents, making it easy to see when a confirmed monitoring issue started, how long it lasted and when it recovered. Incidents can include availability, keyword checks or response-time issues.
See when incidents started
Find out exactly when a problem was detected.
View how long it lasted
See the total duration of each incident.
Check when it recovered
Confirm when your monitor returned to a passing state.
Understand the impact
Use the information to investigate and prevent similar issues in future.
Spot trends and recurring issues
Track performance over time.
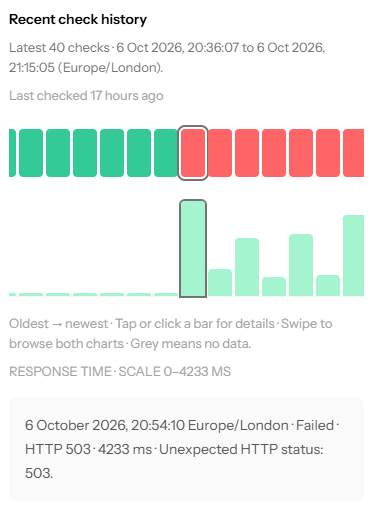
Your monitoring history isn't just useful for investigating problems - it also helps you spot trends and identify recurring issues before they cause downtime.
View response time trends
See how your website is performing over time.
Identify recurring problems
Spot patterns or regular slow periods.
Compare different time periods
Check performance during key events or changes.
Take action
Use the insights to improve your website's reliability.
Data retention
History available on all plans
We keep your monitoring history for a set period of time, depending on your plan. This gives you access to the information you need, whether you're investigating a recent issue or looking at longer term performance.
History retention
Your monitoring history stays available based on your plan.

Leave the night shift to the owl.
Close the laptop. PingHoot will keep watch and alert you when your websites need attention.
Start monitoring for free